
There are four marketing reports: Sell-through & Pace, Promo performance, Audience & geography and Channels & campaigns. They share one page with a tab for each, so you can move between them without losing your place. They are for venue admins; box-office staff cannot open them.
Where to find them
Any of these opens the reports with your venue already selected:
- Admin → Venues → [your venue], then one of the four links in the Marketing reports group
- Admin → Venues → [your venue] → Marketing, then one of the four cards under Reports
- Your venue's Reports page, Automation & marketing group, Marketing reports
At the top of every report:
- the four tabs
- a venue selector — only if you manage more than one venue
- Print / save as PDF — prints the report without the menus around it
- Export CSV — downloads what the current tab is showing. It is greyed out when there is nothing to export.
Sell-through & Pace
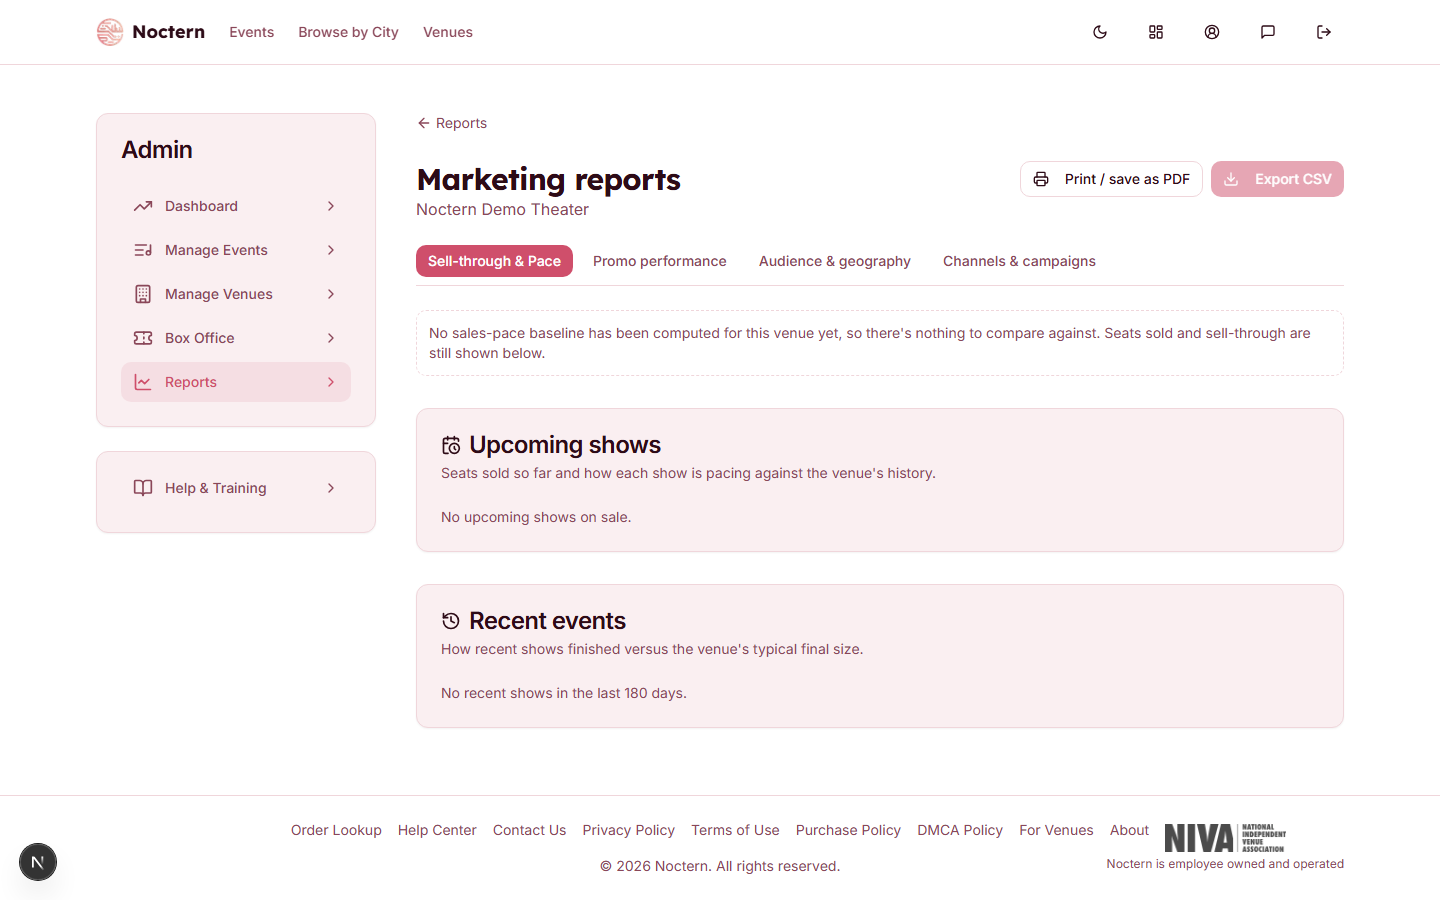
This report answers "is this show selling as fast as our shows usually do?" It counts seats only — there is no revenue on it.
Upcoming shows lists every active show in the next six months (the soonest 100 if you have more). Click a column heading to sort.
| Column | What it shows |
|---|---|
| Event and Date | The show. Click the name to open it. |
| Days out | Days until the show |
| Sold | Seats sold so far, including seats carried over from a previous ticketing system |
| Capacity | The show's general-admission capacity, or the number of seats in its seating layout. A dash means neither is set. |
| Sell-through | Sold as a percentage of capacity |
| Expected by now | The share of its final sales a typical show at your venue has reached this many days out |
| Pace | Ahead, On pace or Behind, with "typical N" — the seats a typical show would have sold by now — and a projection |
A show is Behind when it has sold less than 75% of what a typical show would have by now, Ahead above 115%, and On pace in between. The projection reads "proj ~N" for an estimated final count, "on track to sell out", or — for a show that has sold out — how many days early it filled.
Recent events lists up to 12 shows from the last 180 days with Final tickets, Capacity, Sell-through and vs typical — how many seats above or below a typical show it finished.
Pace needs a baseline built from your past shows. Above the table the report says either "A typical show at your venue sells N tickets" or "No sales-pace baseline has been computed for this venue yet". Without a baseline, Sold, Capacity and Sell-through still work; Expected by now and Pace show a dash. Ask Noctern support to compute the baseline for your venue.
Use this report to decide where to spend effort: a show that is Behind two weeks out is the one to email about.
Promo performance
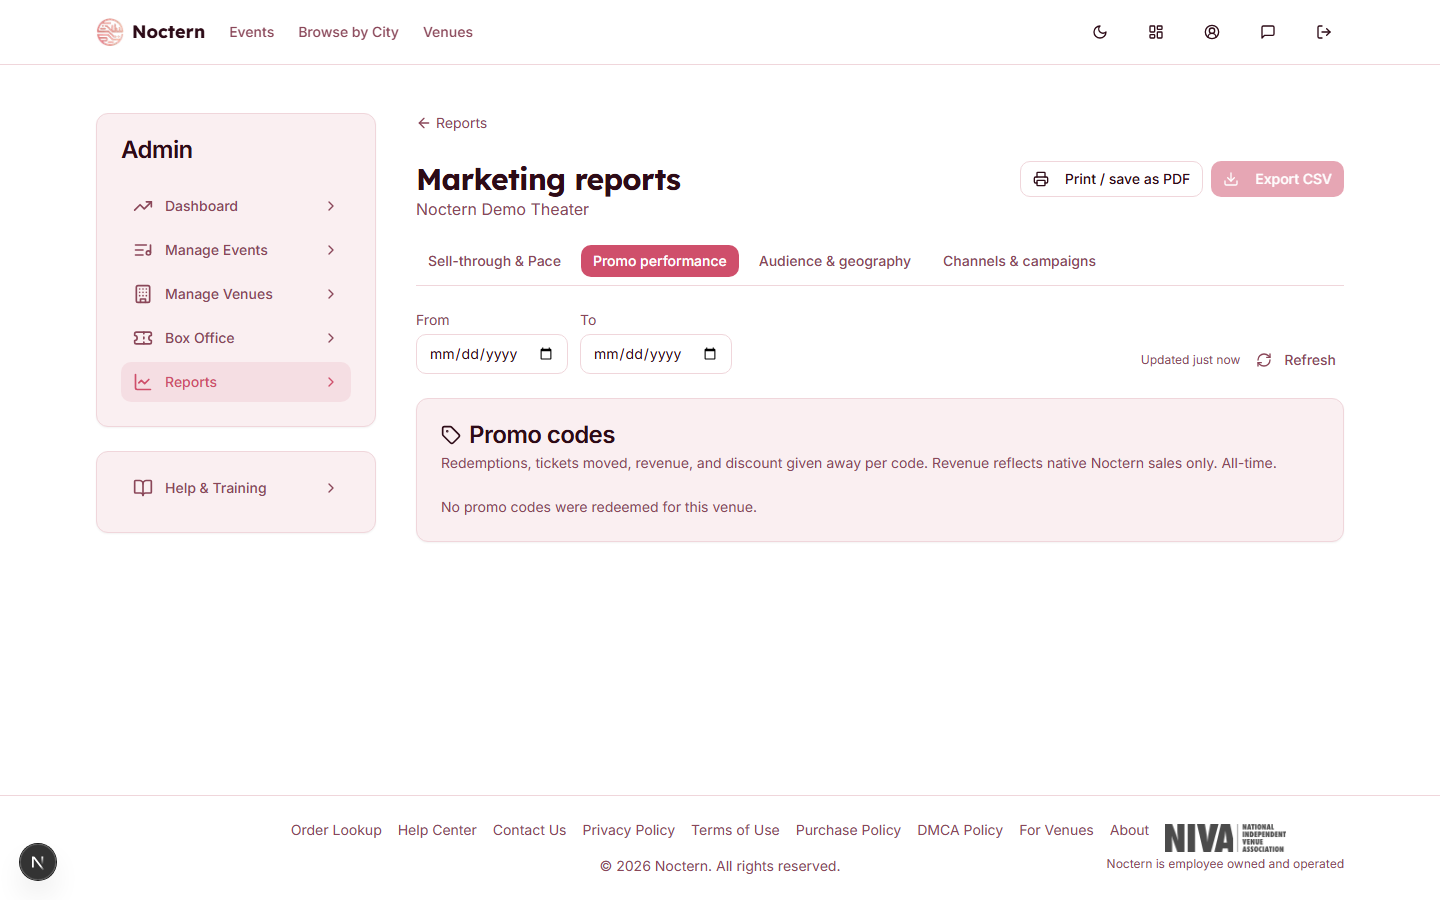
One row for every promo code that has been redeemed.
| Column | What it shows |
|---|---|
| Code | The promo code |
| Type | Percentage, Fixed $ or Max price |
| Scope | Event for a code that belongs to one event, Venue for a venue-wide code |
| Redemptions | Orders that used the code |
| Remaining | Redemptions left before the code's limit. ∞ means no limit. |
| Status | active, scheduled (start date not reached), expired (end date passed), exhausted (limit reached) or inactive (switched off) |
| Tickets | Tickets on those orders |
| Free tickets granted | Tickets given free by a code with a free-ticket benefit |
| Gross revenue | Ticket revenue on those orders |
| Discount given | The total taken off by the code |
| First use and Last use | Dates of the first and latest redemption |
| Events | How many different events the code was used on |
- Click the arrow at the start of a row to see Events this code was used on, with redemptions, tickets, revenue and discount for each.
- Set From and To to limit the report to a date range; Clear dates returns to all-time.
- Totals for everything shown are under the table.
- A code that has never been redeemed does not appear. A dash in Scope, Remaining and Status means Noctern no longer has the code's settings (for example, the code was deleted), so only its past use is known.
- Refunded and cancelled orders are left out. Revenue covers sales made in Noctern, not orders imported from a previous system.
The numbers are saved and reused; "Updated … ago" tells you how old they are, and Refresh recounts now.
To create or change a code, see Managing Promo Codes.
Audience & geography
Counts of your patrons and where they live. There is no revenue on this report.
Audience segments shows Total patrons, Emailable, Ticket buyers, Donors, Recurring donors and Lapsed donors — defined the same way as on the Marketing page. When your data supports it, it also shows New buyers (1 completed order) and Returning buyers (2 or more).
Under the tiles, a line tells you how many patrons have an address on file. The three tables below cover only those patrons, and their percentages are a share of them:
- Top cities — the top 25 on screen
- Top zip codes — the top 25 on screen; ZIP+4 codes are grouped under their 5-digit zip
- State rollup — every state
Export CSV downloads the segment counts and the complete city, zip and state lists in one file. Refresh recounts now.
Use this to choose where to advertise, or which state, city or zip to enter in a By location audience.
Channels & campaigns
Where each event was actually promoted. Counts and statuses only — no revenue.
Channel coverage summarises your upcoming events: how many there are, and how many have No calendar submissions, are Not published anywhere, or have No email campaign.
Upcoming events (the next six months, up to 60) and Recent events (the last 120 days, up to 24) then list, for each event:
| Column | What it shows |
|---|---|
| Calendars | Each external calendar the event was submitted to, with its latest status: Live, Queued, Generating, Submitting, Failed or Skipped |
| Social & discovery | Each platform the event was published to, such as Facebook, Instagram or Twitter / X |
| Email campaigns | How many sent campaigns targeted this event, with their names |
An amber chip — No calendar, Not published, No campaign — marks a gap on an upcoming event that you can still fill. Past events show a dash instead.
The Email campaigns column counts only campaigns whose audience was Buyers of an event for that event. A campaign sent to all patrons, donors or a saved audience is not tied to one event, so it is not counted in any row — even if you picked that show as the Promoted event. The note under the summary tells you how many of those broader campaigns you have sent.
Two further sections appear only when there is something to show:
- Self-reported at checkout — one card for each checkout question you ask, counting how buyers answered over roughly the last 13 months. These are what patrons told you, not tracked clicks. See Asking patrons how they heard about you.
- Where buyers said they heard about us — the same kind of answer from orders imported from your previous ticketing system, if that system recorded it.
For revenue from email, use the Marketing page and Campaign analytics.
Open Sell-through & Pace for your venue and click the Sell-through heading to sort. Then switch to Channels & campaigns and look for amber chips on your next show.