
The Performance Summary report shows how each performance filled its house — how many seats were paid, comped, imported from a previous system, or still available — alongside the gross and net revenue figures for Noctern-native sales.
Go to Admin → Venues → [your venue] → Reports → Performance Summary.
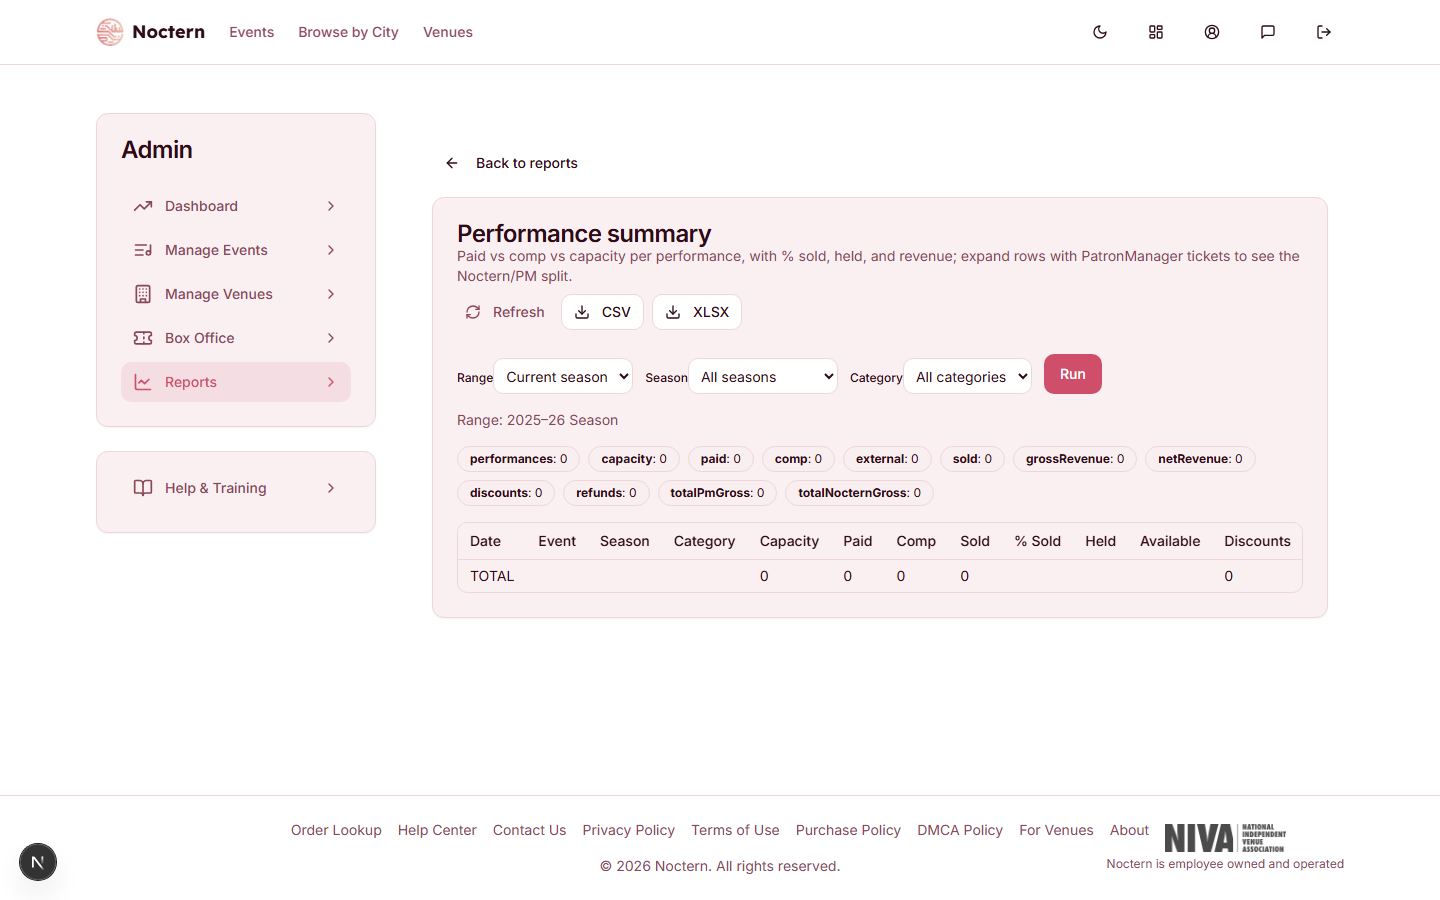
Columns
| Column | What it shows | |---|---| | Capacity | Total seats or GA capacity for the performance | | Paid | Confirmed tickets where the buyer paid a non-zero price | | Comp | Tickets with a price of $0 or recorded with a comp payment method | | Total sold | Paid + Comp + Imported tickets | | % sold | Total sold (all sources) as a share of capacity | | Held | Active seat reservations (checkout sessions in progress) | | Available | Capacity minus sold and held | | Imported tickets | Tickets from imported historical orders (sold before Noctern; real seats, no Noctern revenue) | | Imported face value | The imported tickets' pre-Noctern sale price — display only, kept in its own column and never added into Gross or Net | | Discounts | Promo code savings applied on Noctern sales | | Refunds | Money returned to customers on Noctern sales | | Fees | Noctern service + card fees collected on Noctern sales | | Gross revenue | Face value of active Noctern-native tickets only — imported face value is a separate column and is never combined with it | | Net revenue | Venue's share after Noctern service fees (Noctern-native only) |
Events are grouped by series with a subtotal row per series.
Filtering
Use the filters at the top of the report to narrow the data:
- Date range or Season — filter by calendar dates or a predefined season
- Series — focus on a single event series
- Category — filter by pricing category (for venues that use categories)
Exporting
Click Download CSV or Download XLSX to export the current filtered view. The export requires the canExport capability on your team grant.
External (imported history) tickets are counted as real seats in the capacity math, but the money columns show $0 for them. If your "% sold" appears higher than your revenue suggests, imported-history tickets at the venue are the likely reason.