
The marketing analytics section offers four report views, all accessible from the Admin → Reports → Marketing section. Each view has a venue selector at the top so you can focus on the property you manage.
Sell-through & Pace
Go to Admin → Reports → Marketing → Sell-through & Pace.
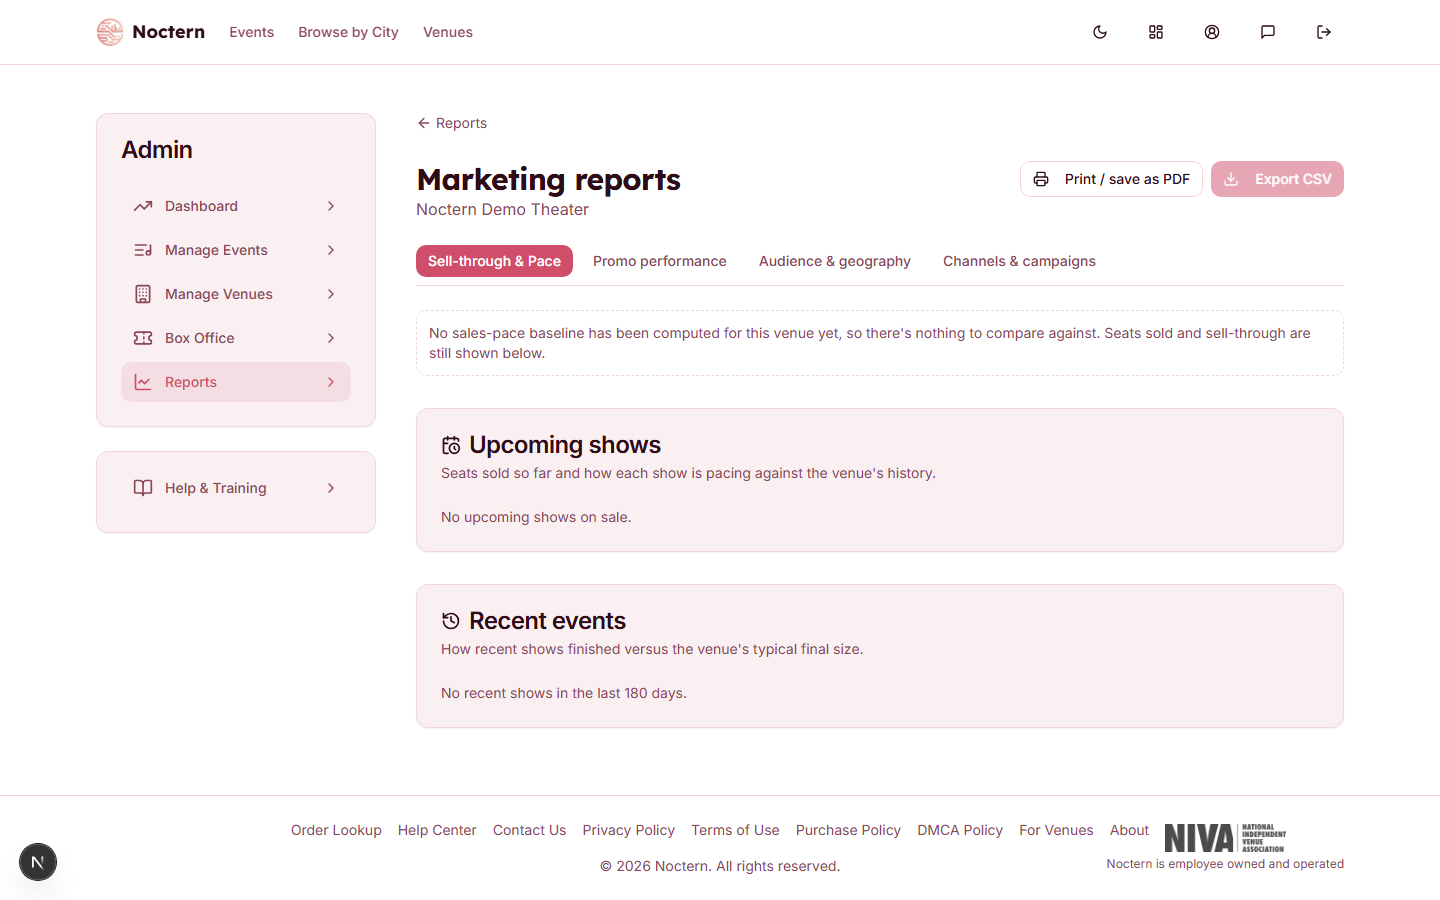
This view answers "how quickly are tickets selling compared with where you'd expect to be at this point?"
- Days-before-event curve — a line chart showing cumulative tickets sold at each point in the pre-event window
- % sold — current tickets sold as a share of total capacity
- Upcoming events selector — switch between events to compare pace
Use this report to decide when to send a campaign: if pace is lagging behind a comparable prior event, now is a good time to reach out.
Audience & Geography
Go to Admin → Reports → Marketing → Audience & Geography.
This view shows where your ticket buyers are coming from geographically:
- Zip code map — a heat map of buyer zip codes; darker areas have more buyers
- State breakdown — ticket count by state
Use this to decide which geographic segments to target in location-based campaign audiences.
Promo Performance
Go to Admin → Reports → Marketing → Promo Performance.
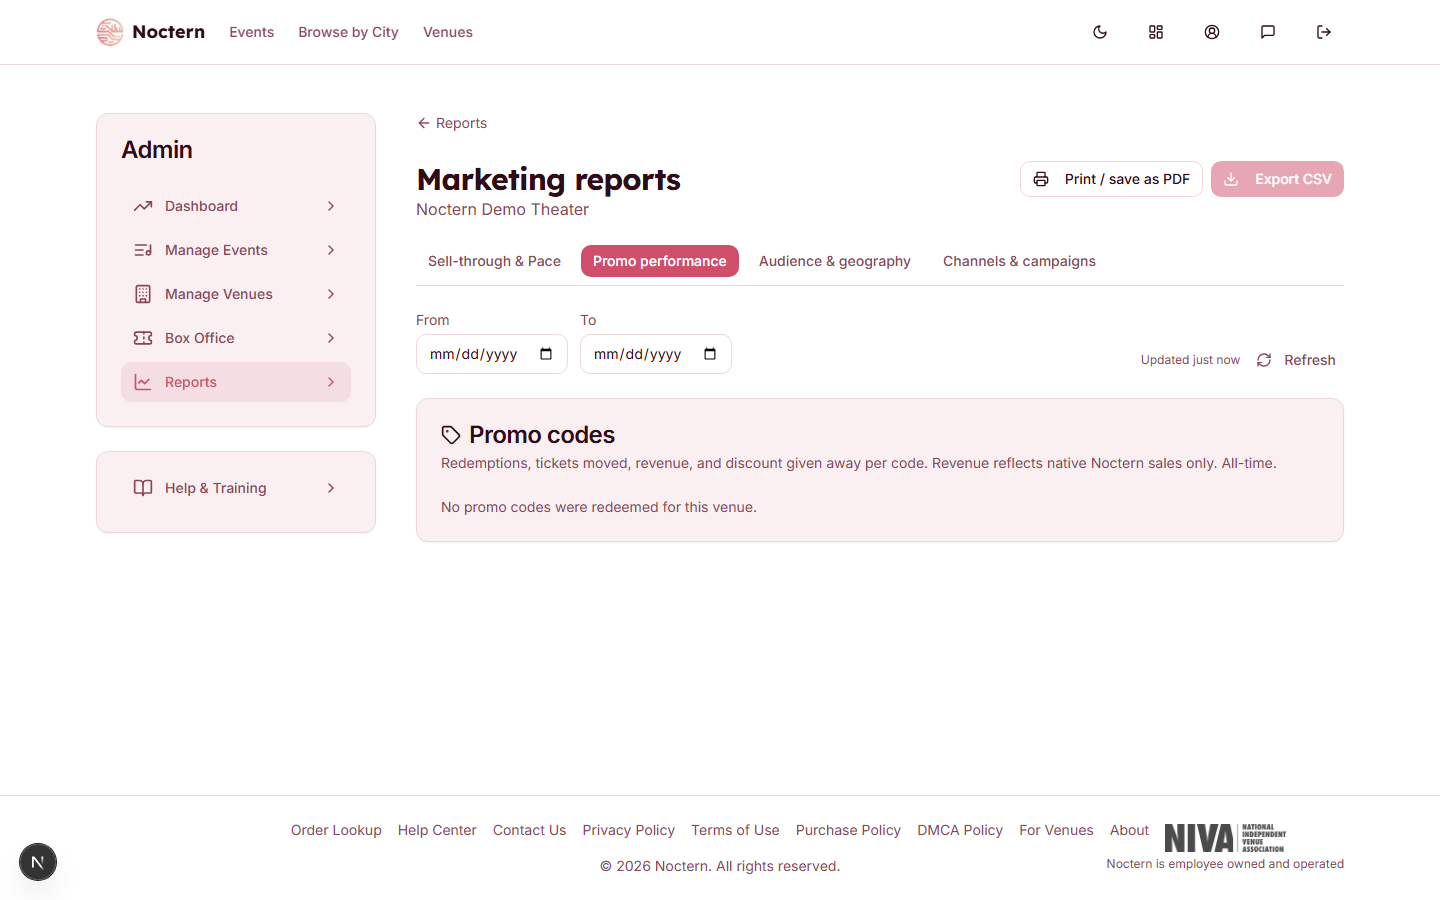
This view shows all promo codes and their current performance:
| Column | What it shows | |---|---| | Code | The promo code string | | Redeemed | Number of times used | | Remaining | Remaining redemptions before the limit is reached | | Status | Active, Scheduled, Expired, or Exhausted | | Scope | Event-level or Venue-level |
Exhausted codes have hit their redemption limit; Scheduled codes are set up but their start date hasn't arrived yet.
Use this view to spot codes that are burning through redemptions faster than expected, or to verify that a promotional campaign drove the usage you expected.
Channels & Campaigns
Go to Admin → Reports → Marketing → Channels & Campaigns.
This view attributes ticket sales to traffic sources:
- Channel breakdown — tickets sold by referral source (direct, social, email, search, etc.)
- Campaign attribution — click-to-purchase rate per campaign, linking email opens and clicks to confirmed orders
Use this to evaluate which campaigns and channels are converting to actual ticket sales.
The promo performance data is also available in the per-venue reports under Admin → Venues → [your venue] → Reports. The marketing section gives you a venue-selector so you can switch between properties without navigating to each venue separately.