
The cross-attendance report reveals how much your audiences overlap across different event series or pricing categories. If 80% of jazz subscribers also attend classical concerts, that's an audience you can cross-promote to confidently.
Go to Admin → Venues → [your venue] → Reports → Cross-attendance.
Smart defaults
Cross-attendance and repeat attendance both need at least one COMPLETED performance to show anything — a brand-new season with tickets on sale but no shows yet is empty by definition. If the selected range has no completed performances, the report automatically falls back to the most recent range that does (previous season, then last 12 months, then all time) and shows a one-line note explaining the swap. You can still pick any range yourself from the Range control.
The Dimension picker defaults to the first dimension that actually has data for your venue (category, then series, then artist) instead of always opening on Category — a dimension with nothing to show is greyed out with "(no data)" rather than silently rendering an empty matrix. If none of your imported history has a category assigned, Category will stay greyed out until events are categorized in Event settings.
On the Reports hub, this tile is hidden entirely for a venue with no usable attendance data at all, and shows a muted "Not enough data yet" badge when only future performances have advance sales so far.
The attendance matrix
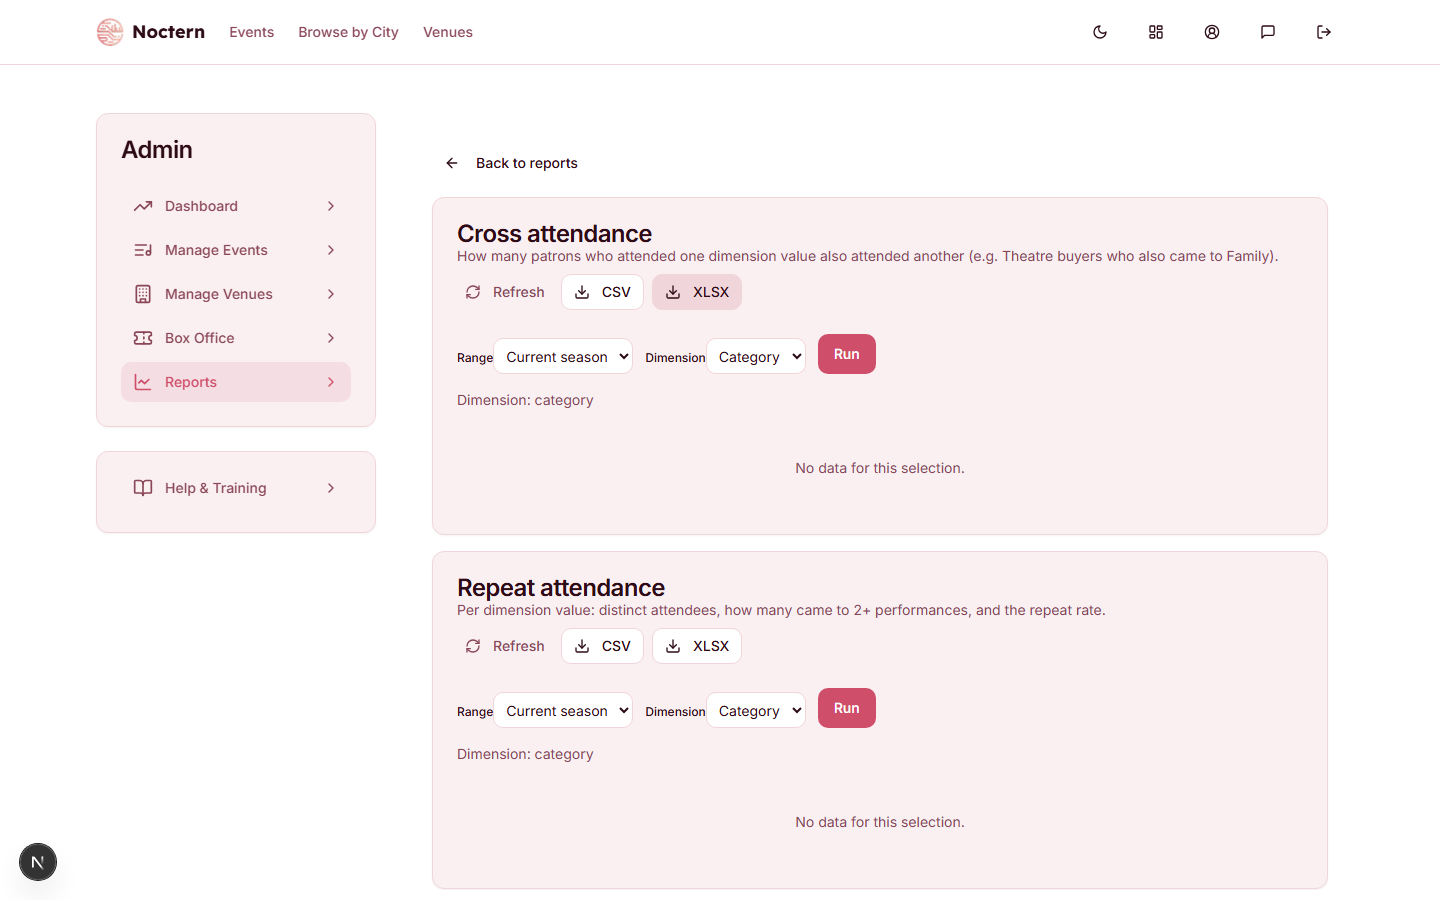
The matrix is a heat map where:
- Rows and columns are dimension values (event series or pricing categories)
- Each cell shows the number of distinct patrons who attended both the row's series and the column's series
- The diagonal shows patrons who attended only that one series/category (single-dimension attendance count)
- Darker colors indicate more overlap
Selecting a dimension
Use the Dimension picker to switch between:
- Series × Series — overlaps across event series
- Category × Category — overlaps across pricing categories
Repeat attendance
Below the matrix, the Repeat attendance table shows per series or category:
- Distinct patrons who attended
- Patrons who came to two or more events in that series
- Repeat rate — the share of attendees who returned at least once
A high repeat rate suggests strong loyalty in that series; a low rate suggests first-timers who didn't come back.
Coverage cap
The matrix is capped at the top 40 dimension values by attendance count. Smaller series or categories are grouped into an Other row/column. If you have more than 40 series and need detail on a specific one, use the Performance Summary filtered to that series instead.
Cross-attendance data is pre-computed nightly. The freshness indicator shows the timestamp of the last update. Sales that occurred today may not yet be reflected.
When you find two series with high cross-attendance, consider building a campaign audience of buyers of Series A who have NOT bought Series B tickets yet. This is a reliable way to convert loyal attendees into cross-series buyers.